Measure Raspberry Pi Temperature with Telegraf, InfluxDB, and Grafana on K3s
In my previous post, I went through the k3s cluster home setup. Now, I’ll show how to measure the temperature of those Raspberry Pi’s using Telegraf, Influxdb, Grafana, and Helm charts.
Why Telegraf?
Telegraf has a plugin called exec, which can execute the commands on the host machine at a specific interval and parses those metrics from their output in any one of the accepted input data formats.
First, deploy the influxdb time series database chart.
apiVersion: helm.cattle.io/v1
kind: HelmChart
metadata:
  name: influxdb
  namespace: kube-system
spec:
  chart: stable/influxdb
  targetNamespace: monitoring
Get Pi temperature
I found this one-liner /sys/class/thermal/thermal_zone0/temp, which returns the temperature of the Pi; divide the output by 1000 to get a result in °C and use awk to have a float value.
awk '{print $1/1000}' /sys/class/thermal/thermal_zone0/tempUpdate Chart values
Update chart values, add [inputs.exec] to config, and deploy it
apiVersion: helm.cattle.io/v1
kind: HelmChart
metadata:
  name: telegraf
  namespace: kube-system
spec:
  chart: stable/telegraf
  targetNamespace: monitoring
  valuesContent: |-
    replicaCount: 2
    image:
      repo: "telegraf"
      tag: "latest"
      pullPolicy: IfNotPresent
    env:
    - name: HOSTNAME
      valueFrom:
        fieldRef:
          fieldPath: spec.nodeName
    config:
      inputs:
        - exec:
            commands: ["awk '{print $1/1000}' /sys/class/thermal/thermal_zone0/temp"]
            name_override: "rpi_temp"
            data_format: "value"
            data_type: "float"
Add Datasource
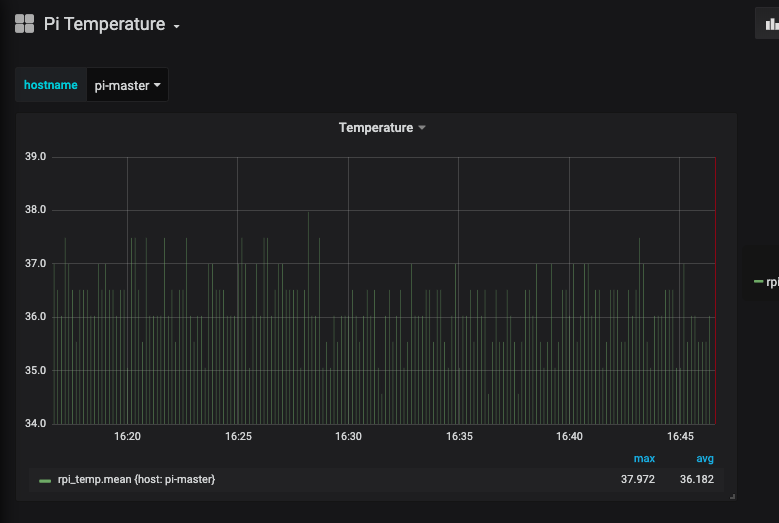
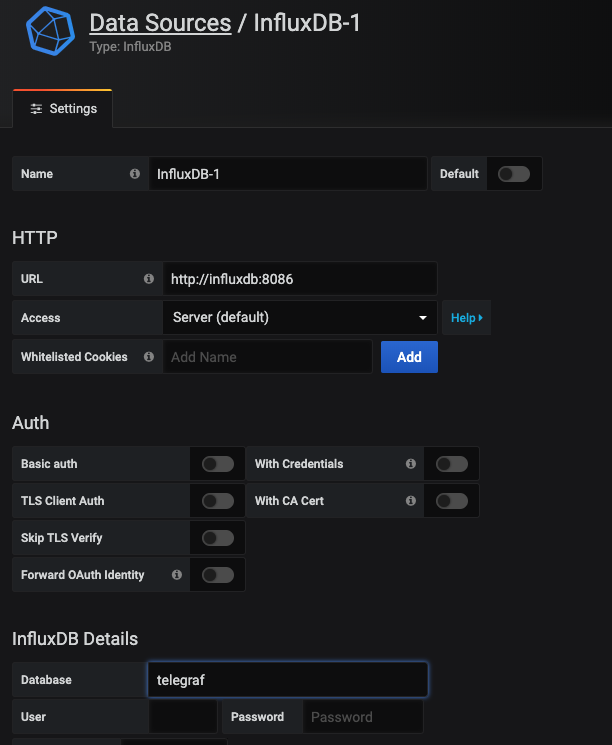
Once influxdb and telegraf pods are ready, add influxdb Datasource in grafana.
Grafana
For Grafana visualization, import this dashboard.