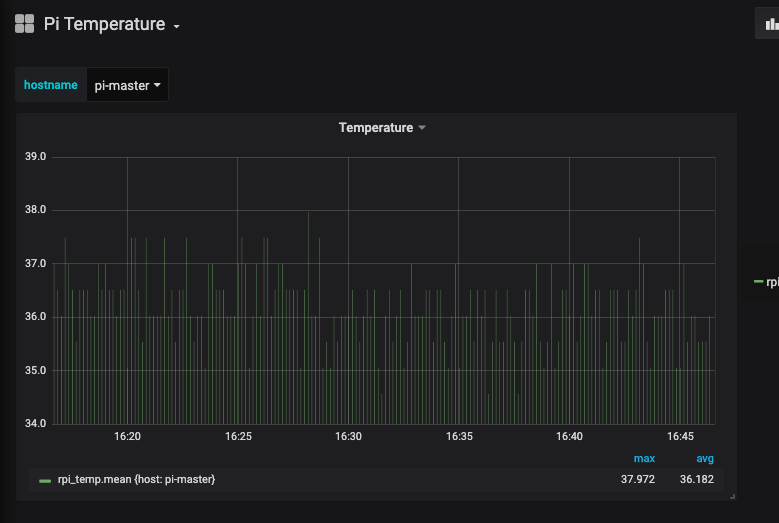
In my previous post, I went through k3s cluster home setup. Now, i’ll show how to measure the temperature of those Raspberry Pi’s using Telegraf, Influxdb, Grafana and Helm charts.
Why Telegraf?
Telegraf has a plugin called exec, which can execute the commands on host machine at certain interval and parses those metrics from their output in any one of the accepted input data formats.
First, deploy influxdb time series database chart
apiVersion: helm.cattle.io/v1
kind: HelmChart
metadata:
  name: influxdb
  namespace: kube-system
spec:
  chart: stable/influxdb
  targetNamespace: monitoring
Get Pi temperature
I found this one liner /sys/class/thermal/thermal_zone0/temp which returns the temperature of the Pi; divide the output by 1000 to get a result in °C and use awk in order to have a float value.
awk '{print $1/1000}' /sys/class/thermal/thermal_zone0/temp
Update Chart values
Update chart values, add [inputs.exec] to config and deploy it
apiVersion: helm.cattle.io/v1
kind: HelmChart
metadata:
  name: telegraf
  namespace: kube-system
spec:
  chart: stable/telegraf
  targetNamespace: monitoring
  valuesContent: |-
    replicaCount: 2
    image:
      repo: "telegraf"
      tag: "latest"
      pullPolicy: IfNotPresent
    env:
    - name: HOSTNAME
      valueFrom:
        fieldRef:
          fieldPath: spec.nodeName
    config:
      inputs:
        - exec:
            commands: ["awk '{print $1/1000}' /sys/class/thermal/thermal_zone0/temp"]
            name_override: "rpi_temp"
            data_format: "value"
            data_type: "float"
Add Datasource
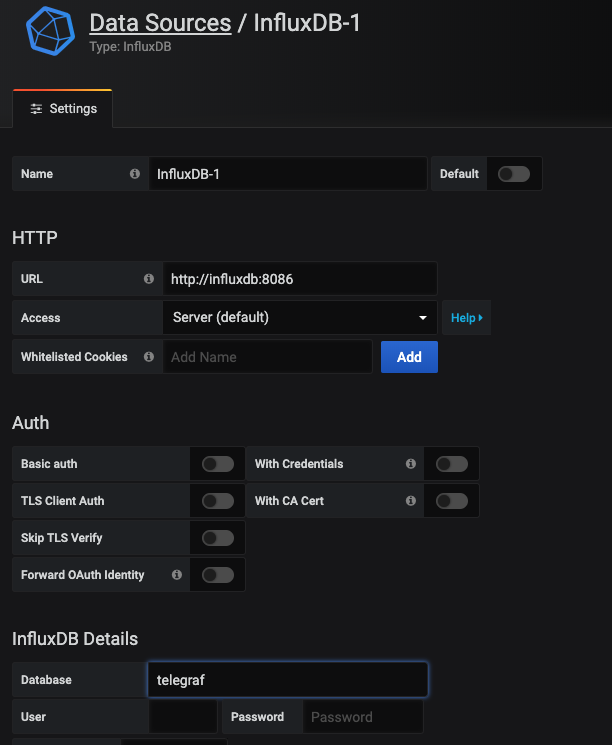
Once influxdb and telegraf pods are in ready state, add influxdb datasource in grafana.
Grafana
For Grafana visualization, import this dashboard.

