Profiling a Java Application in OpenShift Container
Sometimes writing code that runs is not enough. We might want to know what goes on internally, such as memory allocation, consequences of using one coding approach over another, implications of concurrent executions, areas to improve performance, etc. We can use profilers for this.
In this post, I’ll discuss using YourKit-JavaProfiler inside a container.
Since my sample application is built using OpenShift S2I process and pushed into OpenShift internal registry, I’ll have to pull the image locally.
docker login -p $(oc whoami --show-token) -u admin docker-registry.example.com
docker pull docker-registry.example.com/myproject/sample-app:latest
Create a new Dockerfile, add a few lines to install YourKit Java Profiler agents, and expose the profiler agent port.
FROM docker-registry.example.com/myproject/sample-app:latest
RUN wget https://www.yourkit.com/download/docker/YourKit-JavaProfiler-2019.1-docker.zip -P /tmp/ && \
    unzip /tmp/YourKit-JavaProfiler-2019.1-docker.zip -d /usr/local && \
    rm /tmp/YourKit-JavaProfiler-2019.1-docker.zip
EXPOSE 10001
Build and push the image into the registry
docker build . -t docker-registry.example.com/myproject/sample-app-profiler:latest
docker push docker-registry.example.com/myproject/sample-app-profiler:latest
Update the image in the deployment configuration.
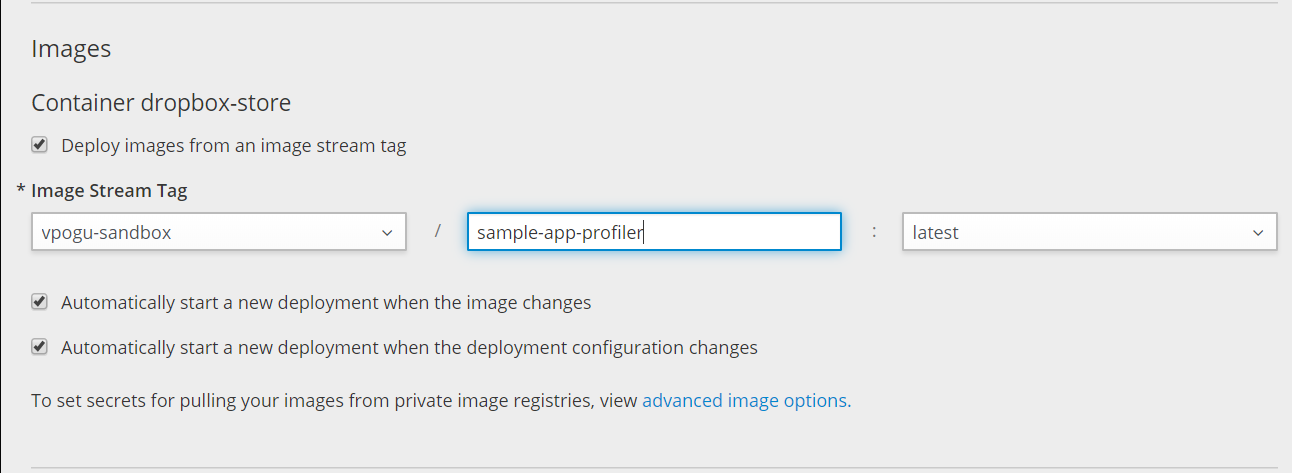
Load the agent into the JVM by adding a JAVA_TOOL_OPTIONS environment variable in the deployment configuration.
$ oc set env dc/MY_APP_NAME JAVA_TOOL_OPTIONS=-agentpath:/usr/local/YourKit-JavaProfiler-2019.01/bin/linux-x86-64/libyjpagent.so=port=10001,listen=all
oc rollout latest dc/MY_APP_NAME
Once the deployment is completed, run oc port forwarding from your local machine to the application pod.
$ oc get pod
NAME                            READY     STATUS      RESTARTS   AGE
MY_APP_NAME-3-1xrsp             1/1       Running     0          6s
...
$ oc port-forward MY_APP_NAME-3-1xrsp 10001:10001
Add a connection in the profiler with localhost:10001, and you’re all set.