Spring Boot Metrics with Prometheus and Grafana in OpenShift
Spring Boot Metrics
This post will discuss how to monitor spring boot application metrics using Prometheus and Grafana.
Prometheus
Prometheus is a monitoring system that collects metrics from configured targets at intervals.
Grafana
Grafana is an open-source metric analytics & visualization tool.
Micrometer
The micrometer is a metrics instrumentation library for JVM-based applications.
Spring Boot Actuator
Spring Boot Actuator helps you monitor and manage your application when it’s pushed to production. You can control and monitor your application using HTTP or JMX endpoints.
Setup
Enable Prometheus metrics by adding dependencies in pom.xml
<dependency>
    <groupId>org.springframework.boot</groupId>
    <artifactId>spring-boot-starter-actuator</artifactId>
</dependency>
<dependency>
    <groupId>io.micrometer</groupId>
    <artifactId>micrometer-core</artifactId>
    <version>1.1.4</version>
</dependency>
<dependency>
    <groupId>io.micrometer</groupId>
    <artifactId>micrometer-registry-prometheus</artifactId>
    <version>1.0.6</version>
</dependency>
By default Prometheus endpoint is not available and must be enabled in application.properties. You can find more configurations at spring-boot docs
#Metrics related configurations
management.endpoint.metrics.enabled=true
management.endpoints.web.exposure.include=*
management.endpoint.prometheus.enabled=true
management.metrics.export.prometheus.enabled=true
management.metrics.distribution.percentiles-histogram.http.server.requests=true
management.metrics.distribution.sla.http.server.requests=1ms,5ms
management.metrics.distribution.percentiles.http.server.requests=0.5,0.9,0.95,0.99,0.999
Optionally you can configure any number with the MeterRegistryCustomizer registry (such as applying common tags).
@Bean
MeterRegistryCustomizer<MeterRegistry> metricsCommonTags() {
    return registry -> registry.config().commonTags("application", "sample-app");
}
Create a new project; deploy the application and Prometheus in OpenShift.
$ oc project myproject
$ oc new-app redhat-openjdk18-OpenShift~<git_repo_URL> -n sample-app
oc new-app prom/prometheus -n prometheus
To keep the Prometheus image and configuration decoupled, use the ConfigMap object to inject the Prometheus deployment with the appropriate configuration data.
cat <<'EOF' > prometheus.yml
global:
  scrape_interval:     5s
  evaluation_interval: 5s

scrape_configs:
  - job_name: 'sample-app'
    metrics_path: '/actuator/prometheus'
    static_configs:
    - targets: ['sample-app:8080']

EOF

oc create configmap prom-config-example --from-file=prometheus.yml
Next, edit the deployment configuration for Prometheus to include this ConfigMap.
oc edit dc/prometheusAdd new volume and volume mount.
- name: prom-config-example-volume
   configMap:
     name: prom-config-example
     defaultMode: 420

- name: prom-config-example-volume
  mountPath: /etc/prometheus/
Use an OpenShift Template to run Grafana with persistent storage.
$ oc process -f https://gist.githubusercontent.com/Vikaspogu/4a67495acf8dba5dc94837e031129fde/raw/e88f42515c6ed101c9554c7c2425794e80e10a64/OpenShift-grafana.yaml | oc apply -f-Once deployed, log in to Grafana using the Route provided in the Template and using the default account admin with password admin (it may be a good idea to change the password after this).
Grafana Data Source
The Grafana template automatically provisions a Prometheus data source,
App-Prometheus, which connects tohttp://prometheus:9090via a proxy connection.This works if there is a Prometheus service (called Prometheus) in the same project as Grafana. If this is not the case, it is necessary to edit the data source to point to the appropriate location.
Grafana Dashboard
- The Grafana template automatically provisions sample dashboards. These dashboards are not comprehensive, but you can use them as a starting point for further customization.
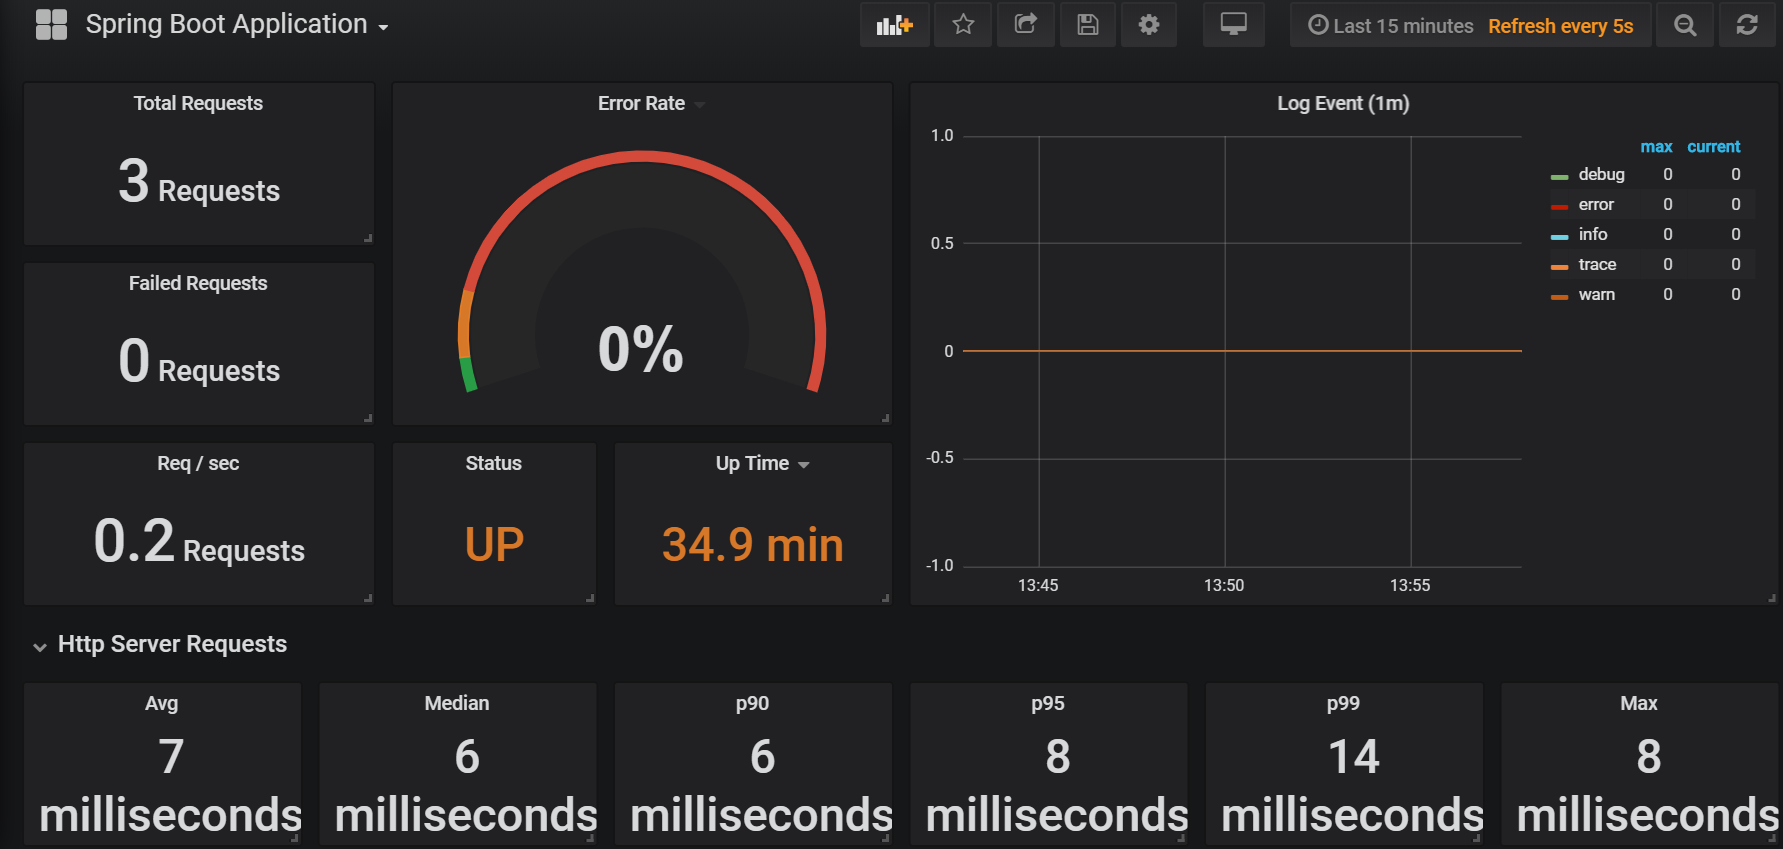
You can find more official & community built grafana dashboards here